- You have no items in your shopping cart
- Continue Shopping


Welcome to the world of open networking with SONiC (Software for Open Networking in the Cloud)! If you’re passionate about deploying and troubleshooting open networks, especially for private cloud environments, then you’re in the right place. Let’s dive into some technical aspects of SONiC, uncover some common issues, and explore how to resolve them. Trust me, troubleshooting SONiC can be as thrilling as solving a complex puzzle!
Understanding Error-Disable Mechanisms
One of the first things to get familiar with are the error-disable mechanisms. They can save you from a lot of headaches but also cause some if you’re not prepared. For instance, link-flap can be a frequent culprit. Here’s how you can identify and troubleshoot link-flap issues in SONiC.
Link-Flap Error-Disable Configuration
Link-flap is a condition where a port experiences rapid up/down transitions, leading to an error-disabled state to prevent network instability[DR1] . The command “show errdisable link-flap” helps you display the status and configuration details of link-flap error-disable.
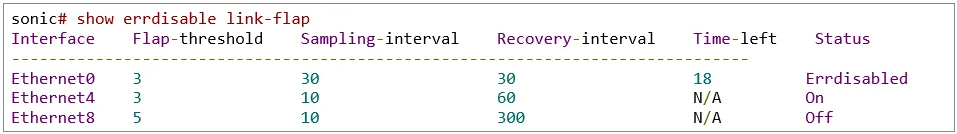
In this table:
- Flap-threshold: Number of flaps within the sampling interval that triggers the error-disable.
- Sampling-interval: Time window during which flaps are counted.
- Recovery-interval: Time after which the port will automatically recover from error-disabled state.
- Time-left: Remaining time for auto-recovery.
- Status: Current state of the port.
Question: Why does Ethernet0 keep getting err-disabled?
Answer: The port has crossed the link-flap threshold within the sampling interval, triggering the error-disable state. To address this, consider increasing the flap threshold or the sampling interval.
Possible Status Values
- Errdisabled: The port is currently in an error-disabled state due to crossing the flap threshold.
- On: The error-disable feature is enabled, but the flap threshold has not been crossed.
- Off: The error-disable parameters are configured, but the feature is not enabled.
Memory Management: The Silent Killer
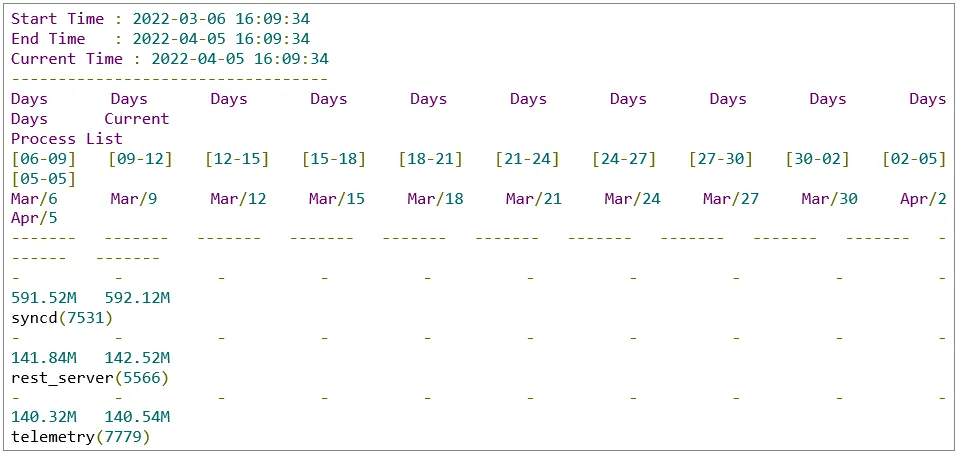
Memory is the lifeblood of any system. In a SONiC environment, it’s crucial to keep an eye on memory usage to prevent out-of-memory (OOM) conditions, which can cause system panics. The memory histogram feature in SONiC helps track memory usage over time, providing a historical perspective on how memory is being consumed by various processes.
Monitoring Memory Usage
To display memory usage data, use the “show histogram memory process” command. This command provides the last 30 days of memory usage for all processes.

Example Output:
Detecting Memory Leaks
Memory leaks can be particularly troublesome as they gradually consume system resources, potentially leading to a system crash. SONiC provides tools to detect these leaks over time.
To analyze memory leaks for a specific process, use the following command:

Example:
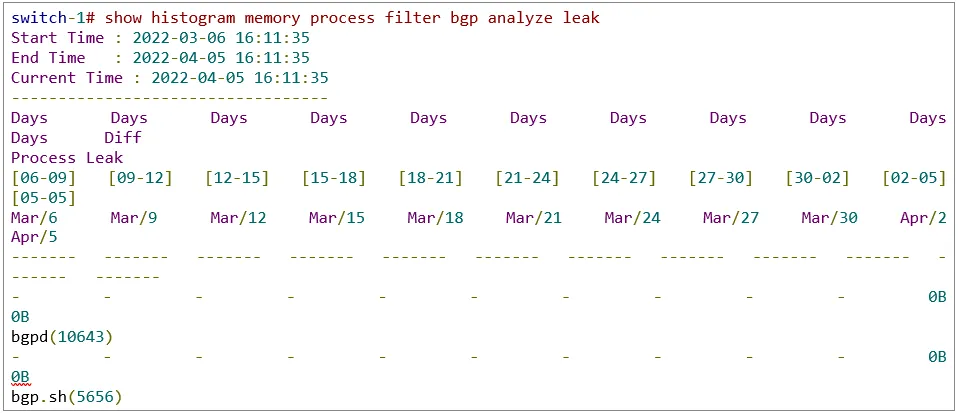
Question: How can I detect memory leaks in my processes?
Answer: Use the “show histogram memory process filter <process_name> analyze leak” command. This command helps identify memory leaks over a specified period, providing insights into processes that might be causing issues.
Interface Down Reason: Simplifying Debugging
Finding out why an interface went down can be like finding a needle in a haystack. SONiC simplifies this with the “show interface status” command, which now includes a “Reason” column. This feature is especially useful for quickly diagnosing and addressing interface issues.
Enhanced Interface Status Information
To see the status and reason for interface down events, use:

Example Output:
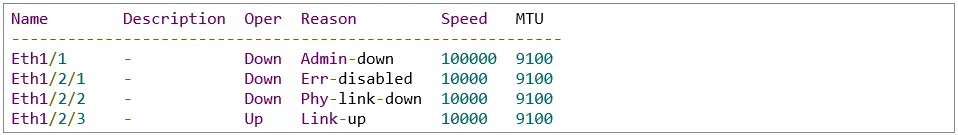
Question: Why is Eth1/2/2 down?
Answer: The reason “Phy-link-down” indicates a physical layer issue, which could be due to a cable fault or a problem with the transceiver. Check the physical connections and replace any faulty components.
Filtering Down Interfaces by Reason
To display all interfaces down for a specific reason:

Example Output:

This command provides a timestamp for when the event occurred, aiding in correlating the issue with network events or changes.
Port Channels: Status Flags and Debugging
SONiC also enhances port channel status reporting with additional operational status flags. These flags help in diagnosing issues with port channels.
Port Channel Summary
To view the status of port channels and their members, use:

Example Output:
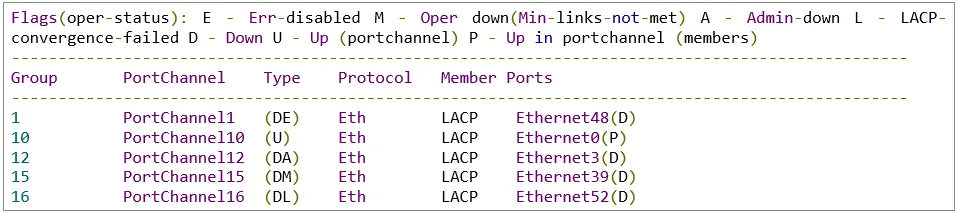
Oper-Status Flags
- Err-disabled: The port channel is error-disabled.
- Min-links-not-met: The minimum number of links required for the port channel is not met.
- Admin-down: The port channel is administratively down.
- LACP-convergence-failed: LACP (Link Aggregation Control Protocol) convergence has failed.
Question: What should I do if a port channel is down due to “Min-links-not-met”?
Answer: Check the status of individual member ports. Ensure that the required number of member ports are up and configured correctly.
SPAN and ERSPAN: Monitoring Traffic Like a Pro
Mirroring traffic can be a lifesaver for troubleshooting. SONiC supports both SPAN (local mirroring) and ERSPAN (remote mirroring). Here’s how to set up and verify these features.
Setting Up SPAN
SPAN (Switchport Analyzer) mirrors traffic from a source port to a destination port. This is useful for analyzing traffic on the same switch.

Mirroring to CPU Example
Mirroring to CPU can be useful for quick troubleshooting when a traffic analyzer is not available.

Question: When should I use SPAN to CPU?
Answer: Use SPAN to CPU for quick troubleshooting when you don’t have a traffic analyzer handy. However, be cautious as it can spike CPU usage.
Setting Up ERSPAN
ERSPAN (Encapsulated Remote SPAN) is used for remote traffic analysis. It encapsulates mirrored packets in a GRE tunnel and sends them to a remote destination.

Verifying Mirror Sessions
To verify mirror sessions:

Real-World Scenarios and Solutions
Scenario 1: Frequent Link Flaps
You’ve noticed that a port keeps getting err-disabled due to link flaps. Increasing the flap threshold or adjusting the sampling interval can help mitigate this issue. Monitor the port’s behavior over time and fine-tune these parameters accordingly.
Scenario 2: Memory Leak Detection
Memory usage on your switch has been steadily increasing. By using the “show histogram memory process” command, you identify that the “bgpd” process is consuming more memory than expected. Using the leak analysis feature, you pinpoint a memory leak and plan for an upgrade or patch to resolve it.
Scenario 3: Interface Down Troubleshooting
An interface goes down, and the reason provided is “Phy-link-down.” Upon inspection, you find a faulty cable. Replacing the cable brings the interface back up, demonstrating the power of having clear, actionable reasons for interface status.
Conclusion
Troubleshooting SONiC can be both challenging and rewarding. By leveraging features like error-disable mechanisms, memory histograms, and interface down reasons, you can effectively manage and maintain a robust open network. Remember, each issue you encounter is an opportunity to deepen your understanding and refine your skills. Happy networking!
Deploying and troubleshooting SONiC in a private cloud environment is a journey filled with learning and problem-solving. Embrace the challenge, and you’ll become a master of open networking!

Infuses our technical support with the narrative depth of a book lover and the strategic acumen of a seasoned gamer. His passion for photography, capturing nature’s tranquil moments, mirrors his meticulous approach to resolving technical complexities.